

Kinetica Data Visualization app for iPhone and iPad
Developer: Jeff Rzeszotarski
First release : 21 Apr 2015
App size: 5.65 Mb
Kinetica is an app for exploring data on your iPad. Instead of forcing you to use a boring old spreadsheet, Kinetica lets you see, touch, sift, and play with your data in a physical environment. Each row of data becomes a circle that responds to your touches and interactions. Want a chart? Pick two columns from your table and then magnetically graph them. Want to filter some data? Grab a sifter and drag it across your data, picking up the points you dont want as you go.
Kinetica started out as a research project studying how we can help people understand information using tablet computers. In developing and testing it, weve had users exploring models of cars trying to find the vehicle for them, understanding deep trends in data about the Titanic shipwreck, and exploring census data to learn about the neighborhoods of Pittsburgh.
Features:
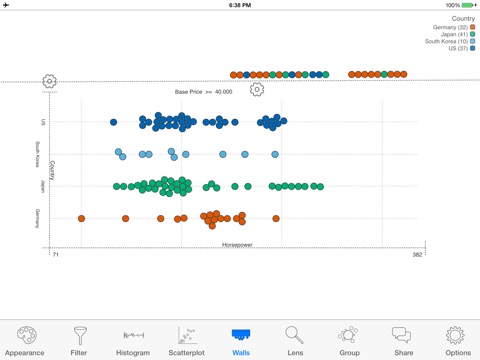
- Magnet charts that pull data to their proper places.
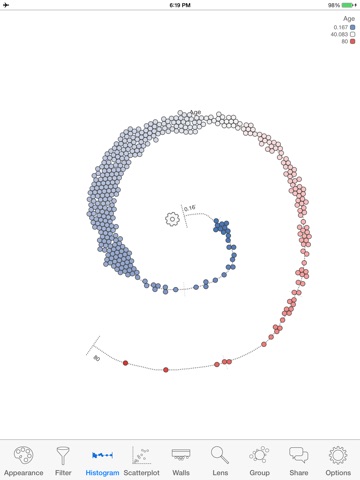
- Interactive sifters that tangibly filter points.
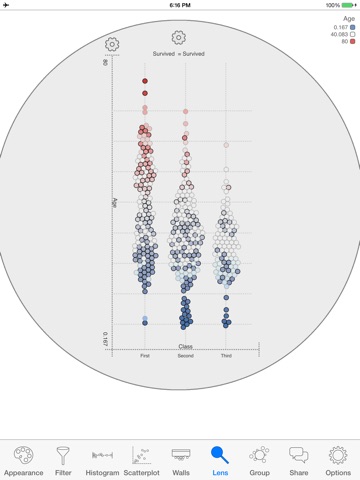
- Lenses that expose hidden trends in the data.
- Tools for grouping, coloring, and sizing points.
- Mix and match techniques to investigate more than 5 dimensions on one iPad screen.
- Save and share discoveries with friends.
- Load any Excel XLS, CSV, and TSV table of data